Debugging
This documentation explains how you can debug your Next.js frontend and backend code with full source maps support using either the VS Code debugger or Chrome DevTools.
Any debugger that can attach to Node.js can also be used to debug a Next.js application. You can find more details in the Node.js Debugging Guide.
Debugging with VS Code
Create a file named .vscode/launch.json at the root of your project with the following content:
{
  "version": "0.2.0",
  "configurations": [
    {
      "name": "Next.js: debug server-side",
      "type": "node-terminal",
      "request": "launch",
      "command": "npm run dev"
    },
    {
      "name": "Next.js: debug client-side",
      "type": "chrome",
      "request": "launch",
      "url": "http://localhost:3000"
    },
    {
      "name": "Next.js: debug full stack",
      "type": "node",
      "request": "launch",
      "program": "${workspaceFolder}/node_modules/.bin/next",
      "runtimeArgs": ["--inspect"],
      "skipFiles": ["<node_internals>/**"],
      "serverReadyAction": {
        "action": "debugWithEdge",
        "killOnServerStop": true,
        "pattern": "- Local:.+(https?://.+)",
        "uriFormat": "%s",
        "webRoot": "${workspaceFolder}"
      }
    }
  ]
}
npm run dev can be replaced with yarn dev if you're using Yarn or pnpm dev if you're using pnpm.
If you're changing the port number your application starts on, replace the 3000 in http://localhost:3000 with the port you're using instead.
If you're running Next.js from a directory other than root (for example, if you're using Turborepo) then you need to add cwd to the server-side and full stack debugging tasks. For example, "cwd": "${workspaceFolder}/apps/web".
Now go to the Debug panel (Ctrl+Shift+D on Windows/Linux, ⇧+⌘+D on macOS), select a launch configuration, then press F5 or select Debug: Start Debugging from the Command Palette to start your debugging session.
Using the Debugger in Jetbrains WebStorm
Click the drop down menu listing the runtime configuration, and click Edit Configurations.... Create a Javascript Debug debug configuration with http://localhost:3000 as the URL. Customize to your liking (e.g. Browser for debugging, store as project file), and click OK. Run this debug configuration, and the selected browser should automatically open. At this point, you should have 2 applications in debug mode: the NextJS node application, and the client/ browser application.
Debugging with Chrome DevTools
Client-side code
Start your development server as usual by running next dev, npm run dev, or yarn dev. Once the server starts, open http://localhost:3000 (or your alternate URL) in Chrome. Next, open Chrome's Developer Tools (Ctrl+Shift+J on Windows/Linux, ⌥+⌘+I on macOS), then go to the Sources tab.
Now, any time your client-side code reaches a debugger statement, code execution will pause and that file will appear in the debug area. You can also press Ctrl+P on Windows/Linux or ⌘+P on macOS to search for a file and set breakpoints manually. Note that when searching here, your source files will have paths starting with webpack://_N_E/./.
Server-side code
To debug server-side Next.js code with Chrome DevTools, you need to pass the --inspect flag to the underlying Node.js process:
NODE_OPTIONS='--inspect' next devIf you're using npm run dev or yarn dev then you should update the dev script on your package.json:
{
  "scripts": {
    "dev": "NODE_OPTIONS='--inspect' next dev"
  }
}
Launching the Next.js dev server with the --inspect flag will look something like this:
Debugger listening on ws://127.0.0.1:9229/0cf90313-350d-4466-a748-cd60f4e47c95
For help, see: https://nodejs.org/en/docs/inspector
ready - started server on 0.0.0.0:3000, url: http://localhost:3000
Once the server starts, open a new tab in Chrome and visit chrome://inspect, where you should see your Next.js application inside the Remote Target section. Click inspect under your application to open a separate DevTools window, then go to the Sources tab.
Debugging server-side code here works much like debugging client-side code with Chrome DevTools, except that when you search for files here with Ctrl+P or ⌘+P, your source files will have paths starting with webpack://{application-name}/./ (where {application-name} will be replaced with the name of your application according to your package.json file).
Inspect Server Errors with Chrome DevTools
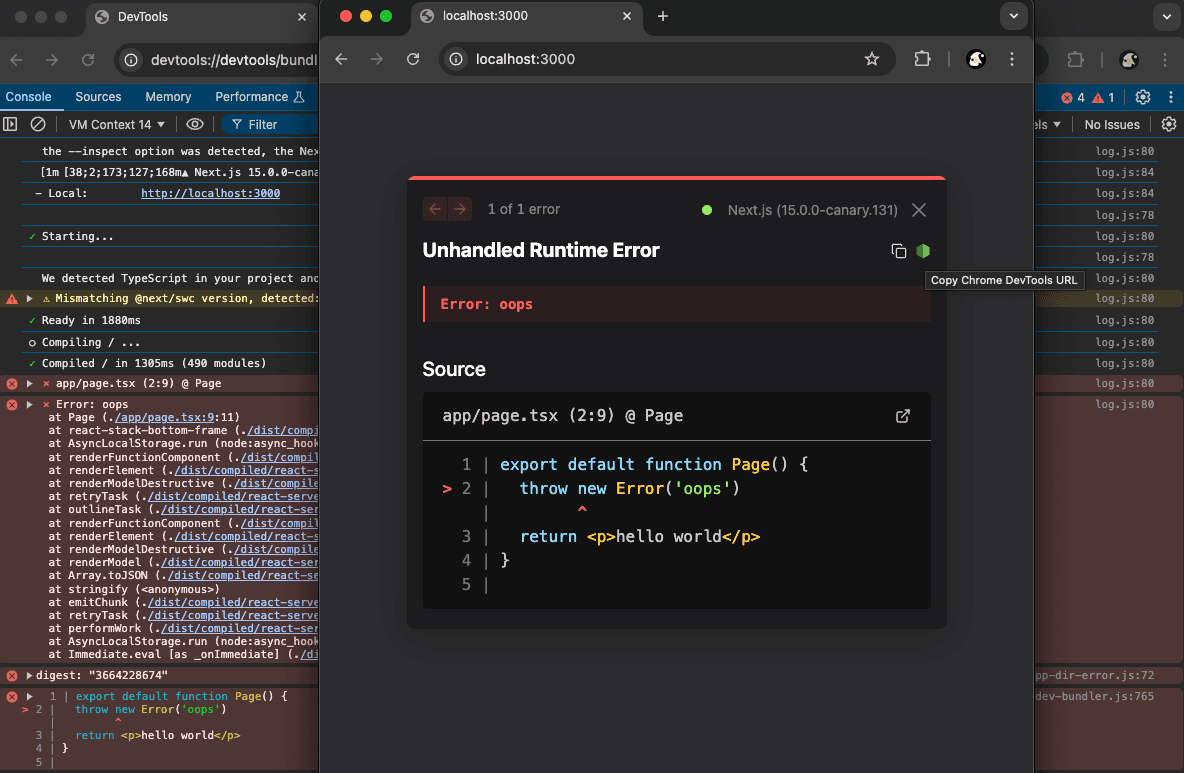
When you encounter an error, inspecting the source code can help trace the root cause of errors.
Next.js will display a Node.js logo like a green button on the dev overlay. By clicking that button Chrome DevTool url is copied into clipboard, and you can open a new browser tab with that url to inspect the Next.js server process with Chrome DevTool.


Debugging on Windows
Windows users may run into an issue when using NODE_OPTIONS='--inspect' as that syntax is not supported on Windows platforms. To get around this, install the cross-env package as a development dependency (-D with npm and yarn) and replace the dev script with the following.
{
  "scripts": {
    "dev": "cross-env NODE_OPTIONS='--inspect' next dev"
  }
}
cross-env will set the NODE_OPTIONS environment variable regardless of which platform you are on (including Mac, Linux, and Windows) and allow you to debug consistently across devices and operating systems.
Good to know: Ensure Windows Defender is disabled on your machine. This external service will check every file read, which has been reported to greatly increase Fast Refresh time with
next dev. This is a known issue, not related to Next.js, but it does affect Next.js development.
More information
To learn more about how to use a JavaScript debugger, take a look at the following documentation:
Was this helpful?